Two Years, 100+ Sets of Testing Results Confirm:
Machines Can Beat Human Aces in Stock Market!
|
|
AlphaGo, an AI Go game software system, beat
World Go champion Lee Sedol in 2016. Then, AlphaGo Master defeated Ke Jie,
the world No. 1 ranking Go player in 2017. At this point, in Go, the most
racking-brains game in the field of board and card games, the result of
Human-Machine Battle has been settled, machine swept all the top human
masters. The power of artificial intelligence (AI) is invincible and no
doubt about it.
The next logical question could be : "What would
happen if the stock market had a Human-Machine Battle?"
About this
question, people's views are not as certain as board and card games. Most
people advocate that machines and Artificial Intelligence technology can not
defeat human beings in the fields of economy and finance. The reason is
simple:
There are boundaries, clear rules, unified standards, clear
order of taking turns, equal opportunities for all sides in board and card
games. For machines with strong computing power, certain results can be
solved sooner or later. And when it comes to computing power, of course,
humans can't compete with sleepless computers.
Economics, finance and
securities are quite different. There are no boundaries, neither orders and
equality. And rules are fuzzy, standards are uneven in these fields. In the
stock market, big institutional investors have much more insider information
than retail investors dreaming for. Even the same piece of information
published under the fairest conditions can be interpreted in opposite ways.
The stock market is a chaotic market, where the fluctuations are not
entirely caused by economic activities, but certain partly by human
emotions.
Computers can calculate astronomical figures that people
can not image, but it is impossible to calculate the hearts of people, human
nature and human feelings.
This, of course, makes sense. However,
with the rapid development of Artificial Intelligence technology, there are
always some "technical maniacs" against this tone. They've challenged this
"mission impossible" over and over again, even built two ETFs powered
entirely by AI, which have indeed outperformed most human fund managers, but
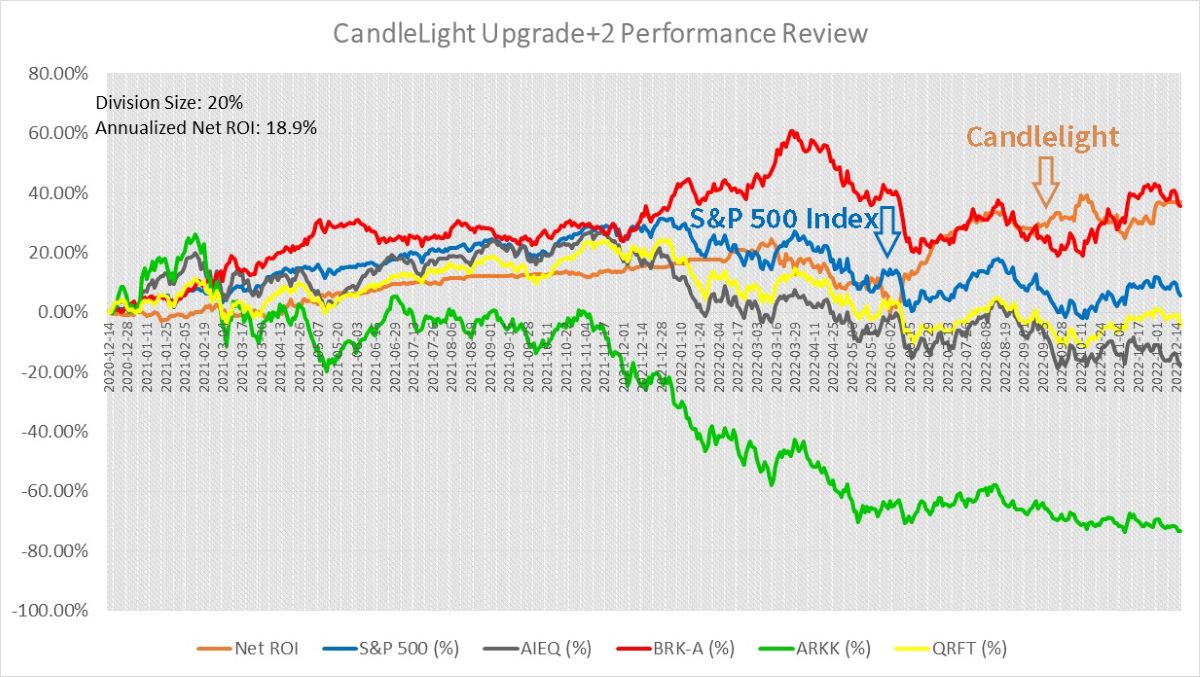
far weaker than Warren Buffett, the best human stock trading master. Here's
a comparison of their growth rates:
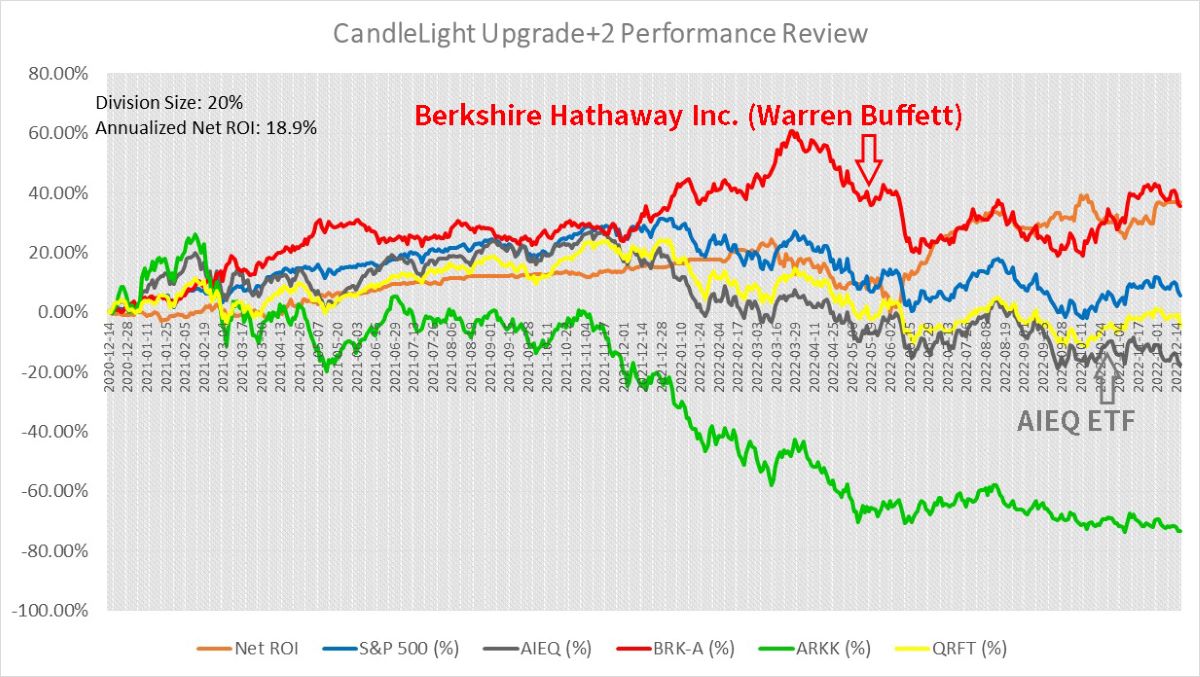
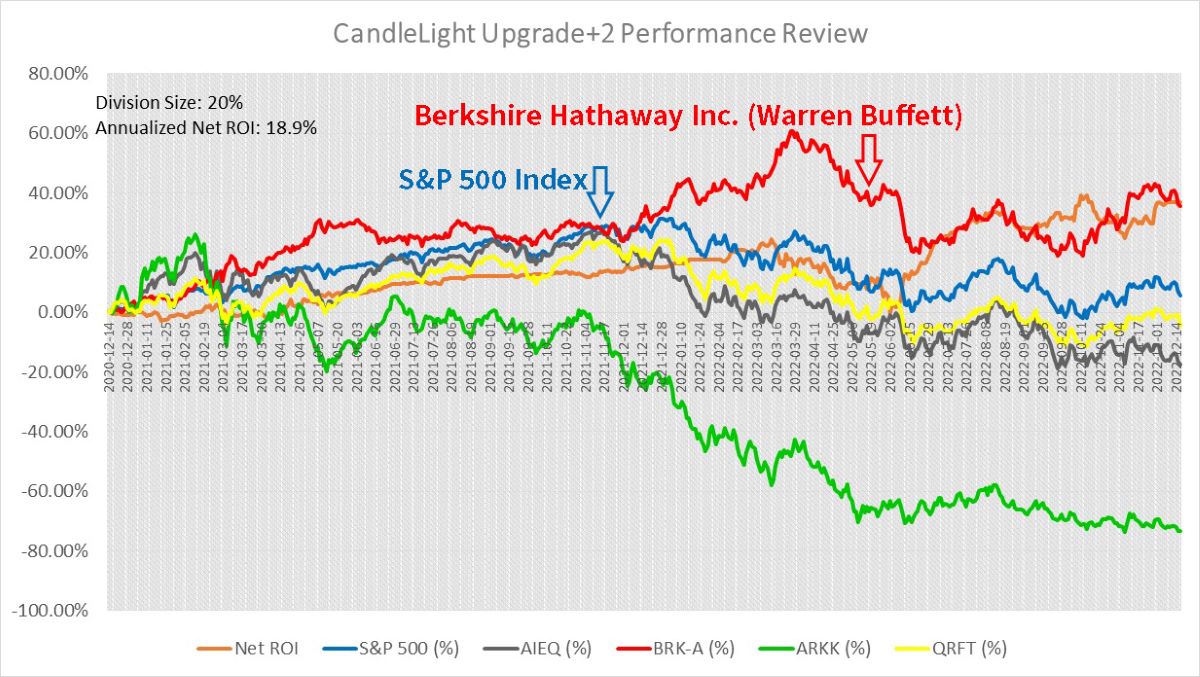
Since December 14, 2020, the growth rate of Berkshire Hathaway Inc.
stock BRK-A (red line), owned and managed by Warren Buffett, has been
outpacing AIEQ (gray line), the first ETF powered by Artificial intelligence
machines in the world. AIEQ only surpassed Buffett shortly on November 18,
2021. Only one day later, it was reversed by Buffett, and then fell into a
slump, and falling far behind.
So it is right to believe that in the
"Human-Machine Battle" in the stock markets, the machine cannot win...
Wait a minute!
Look at the same chart, July 5, 2022, an orange
line is catching up and overtaking the red line!
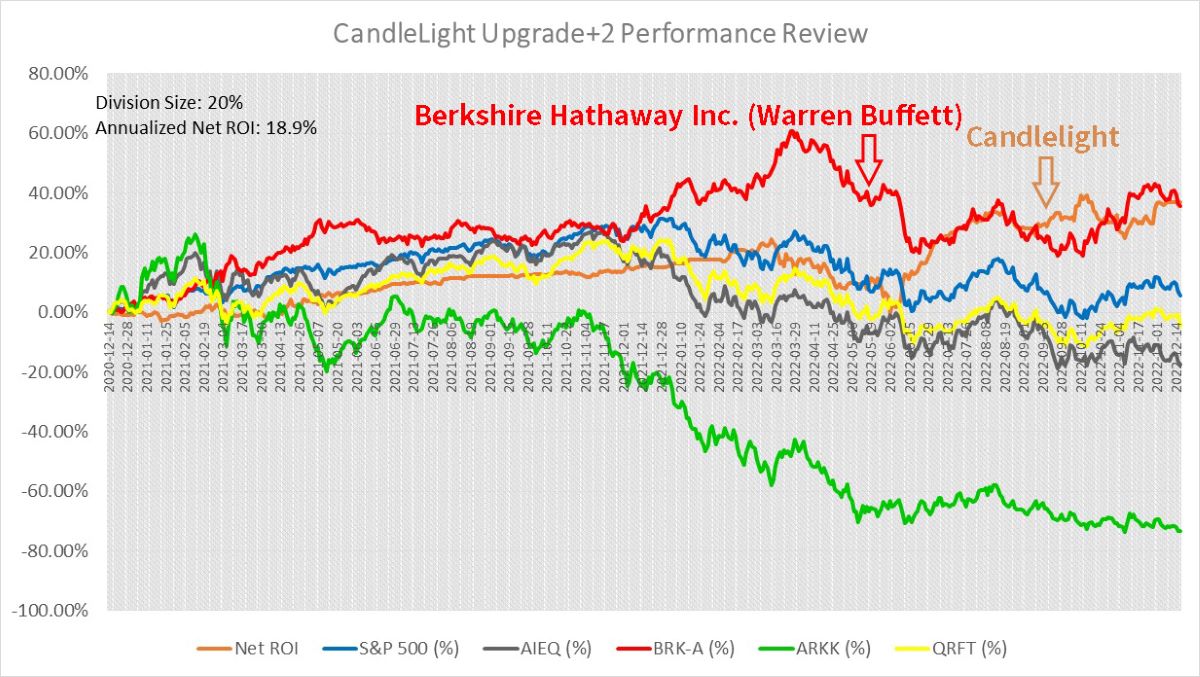
The orange line represents the growth rate of Candlelight, another AI
trading system. Starting from December 14, 2020, this AI quantitative
trading system developed by us has been continuously tested (test
conditions: real time, real field, real price and virtual capital). Since
then, the growth rate of "Candlelight" AI quantitative trading system has
been slowly climbing.
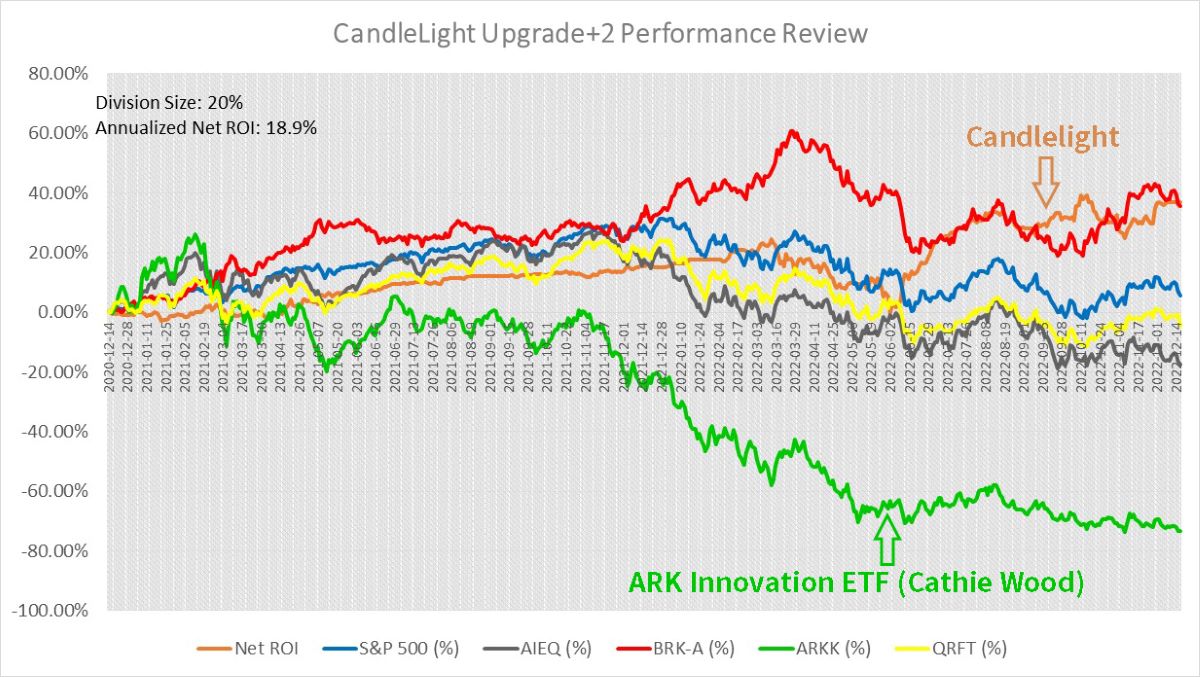
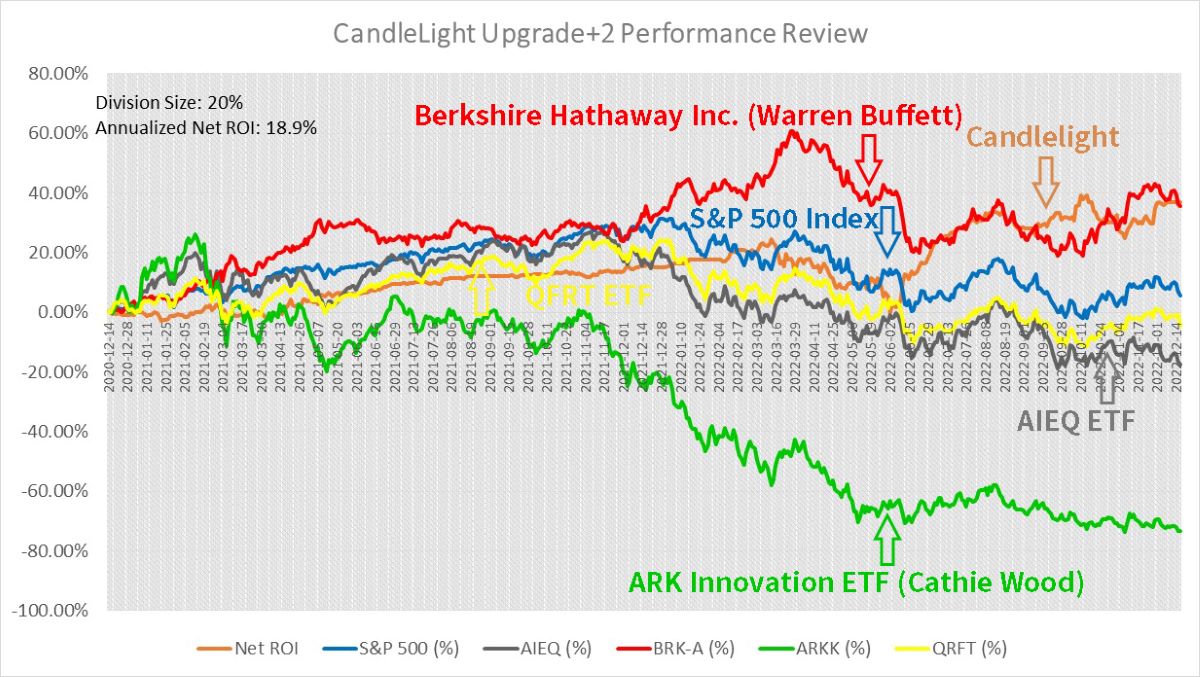
In April 2021, Candlelight outperformed ARKK
(green line), The ARK Innovation ETF managed by Cathie Wood. Ms. Wood was
admired by many fans after her breakout years in 2020 and early 2021. This
was the first milestone for Candlelight.
In January 2022, Candlelight surpassed its rival, AIEQ. AIEQ is equipped
with IBM's "Watson" supercomputer hardware platform and Google's AI software
platform. No matter whether its hardware or software, it is representing the
highest level of Artificial Intelligence technology in the world.
In
May 2021, Candlelight shortly surpassed AIEQ. After January 2022,
Candlelight quickly ran away from AIEQ and has remained in the lead ever
since. Surpassing AIEQ marks the second important milestone of Candlelight.
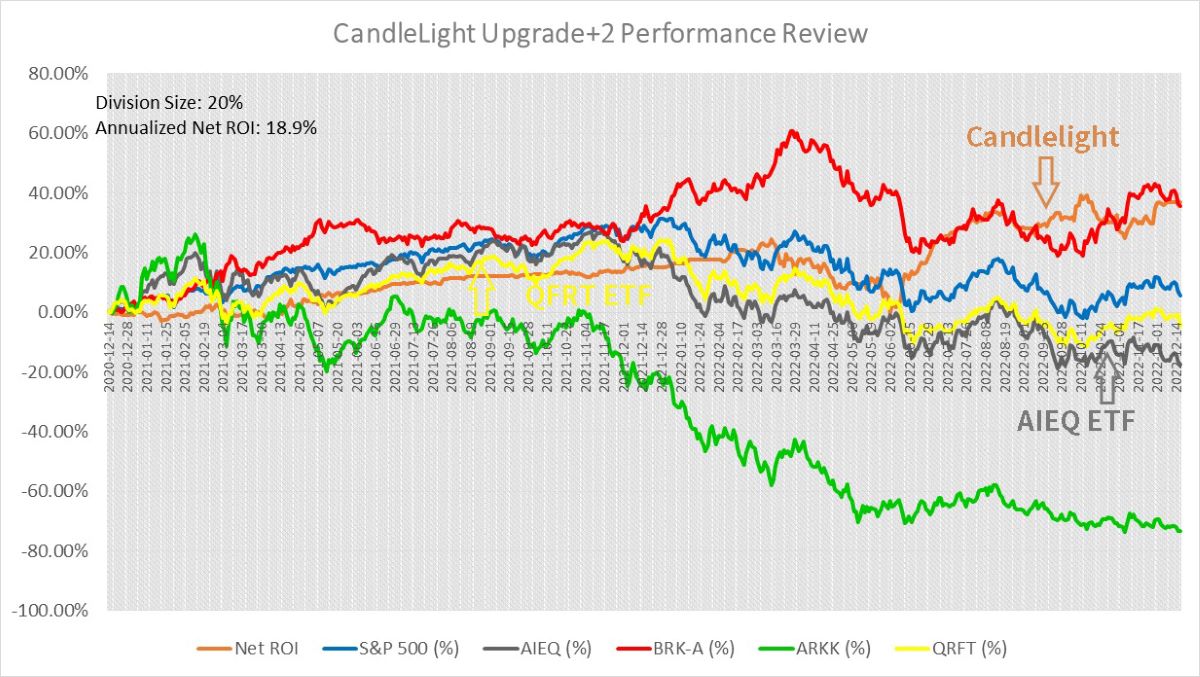
QRFT (yellow line) is another AI-driven ETF. Unlike AIEQ, which uses IBM's
"Watson" supercomputer general-purpose platform, QRFT claims to use AI
systems specifically designed and developed for investment task. Its
performance in real operation is as same as AIEQ roughly. The Candlelight
system established a lead over QRFT after June 2022.
In March 2022,
Candlelight surpassed the growth rate of the S&P 500 Index (blue line) for
the first time. July, Candlelight surpassed the S&P 500 Index again,
officially passing the third milestone and maintaining the advantage, which
means that the profitability of the pure machine trading system outperforms
the market.
This seeming low-end target is actually beyond the reach of many human
fund managers, and even Warren Buffett's growth rate was briefly suppressed
by the Index in November 2021.
That's why he repeatedly advises inexperienced investors to buy index
funds on a regular basis. Buffett first mentioned his advice in his 1993
letter to Investors, quoting: "By periodically investing in an index fund,
for example, the know-nothing investor can actually outperform most
investment professionals."
On July 5, 2022, after 19 months of
continuous forward testing, the latest version of "Candlelight" finally
passed the fourth milestone and surpassed Buffett's growth rate for the
first time. To be honest, when we developed this software, we did not expect
to be able to compete with the top human master, Mr. Buffett. Our goal is to
beat another machine operating fund AIEQ only, that is enough to prove that
our machine's algorithm is better than the peer, the design goal is 100%
achieved. Satisfied. Especially from March to May 2022, under the
superimposed impact of war, inflation, interest rate hike and other major
impacts, the growth rate of "Candlelight" once suffered a heavy decline,
which was left a dozen streets away by master Buffett, and even faced the
dilemma of being surpassed again by the rival AIEQ. As we have been very
frustrated, Candlelight AI Quantitative Trading System drives machine to
make a series of adjustments, fights back continuously, finally get rid of
the darkness and weakness. July 5, 2022, unexpectedly, narrowly exceeded
Warren Buffet’s performance, which was unreachable before, completed a
"mission impossible".
On October 13, 2022, Candlelight stepped on its fifth milestone: the
completion of a full 100 forward testing transactions. As we all know,
repeatability is a hard-core indicator to verify a model. The success of one
or two sets of experiments does not mean anything. The results of ten or
eight sets of experiments could be also highly contingence. Only when
certain phenomena can be repeated, we can be sure that they are not
coincidental. After 22 months, since December 14, 2020 to October 13, 2022.
The operation of 100 opening and closing positions completely carried out by
machines has basically tested the Repeatability and Robustness of the
Candlelight system, in the complex market environment.
On December
14, 2022, Candlelight passed its sixth milestone: two years of continuous
forward testing. While the Quantity of tests is a very important hardcore
metric, there is another metric that is equally important: Time Span. In
addition to the constraints of boundaries, rules, criteria, order, and so on
mentioned above, there is another big difference between stock trading and
board/card games: stock trading will be influenced greatly by the dimension
of time.
The time span factor is not considered in the programming of
AI for board and card games. As long as the results of a batch of tests
confirm that the algorithm works, it is feasible, even if these sets of
tests are completed intensively in a short period of time, because the test
objects do not have periodic fluctuations. The test subjects of board and
card games are the rules of the games themselves, which are eternal and do
not change over time.
Stock trading is another story. It is a part of
human economic activity, and it rises and falls with the fluctuations of
financial markets. Such financial market fluctuations not only come from the
economic activities themselves, nor reflect the supply and demand
relationship of commodities alone. More often, they are also closely related
to the political environment and natural changes, not to mention
unpredictable shocks such as wars, epidemics and disasters. In any country,
under any economic system, economic and market cyclical fluctuations are
unavoidable. From three or five years to ten or eight years, human economic
activity has always been a cycle of booms and busts. Even within a year,
with the climate of cold and warm change, various markets have varying
degrees of peak-season and off-season shock.
Therefor, quantitative
trading systems developed for stock markets must also be able to withstand
the test of economic fluctuations to be practical. If only a short period of
intensive testing is successful, it just means that the system works in one
economy situation and may not reproduce the same results in another. We
believe that a truly effective AI quantitative trading system should cover
at least one cycle of booms and busts, and the more economic fluctuations it
can span, the more battle-ready the system will be.
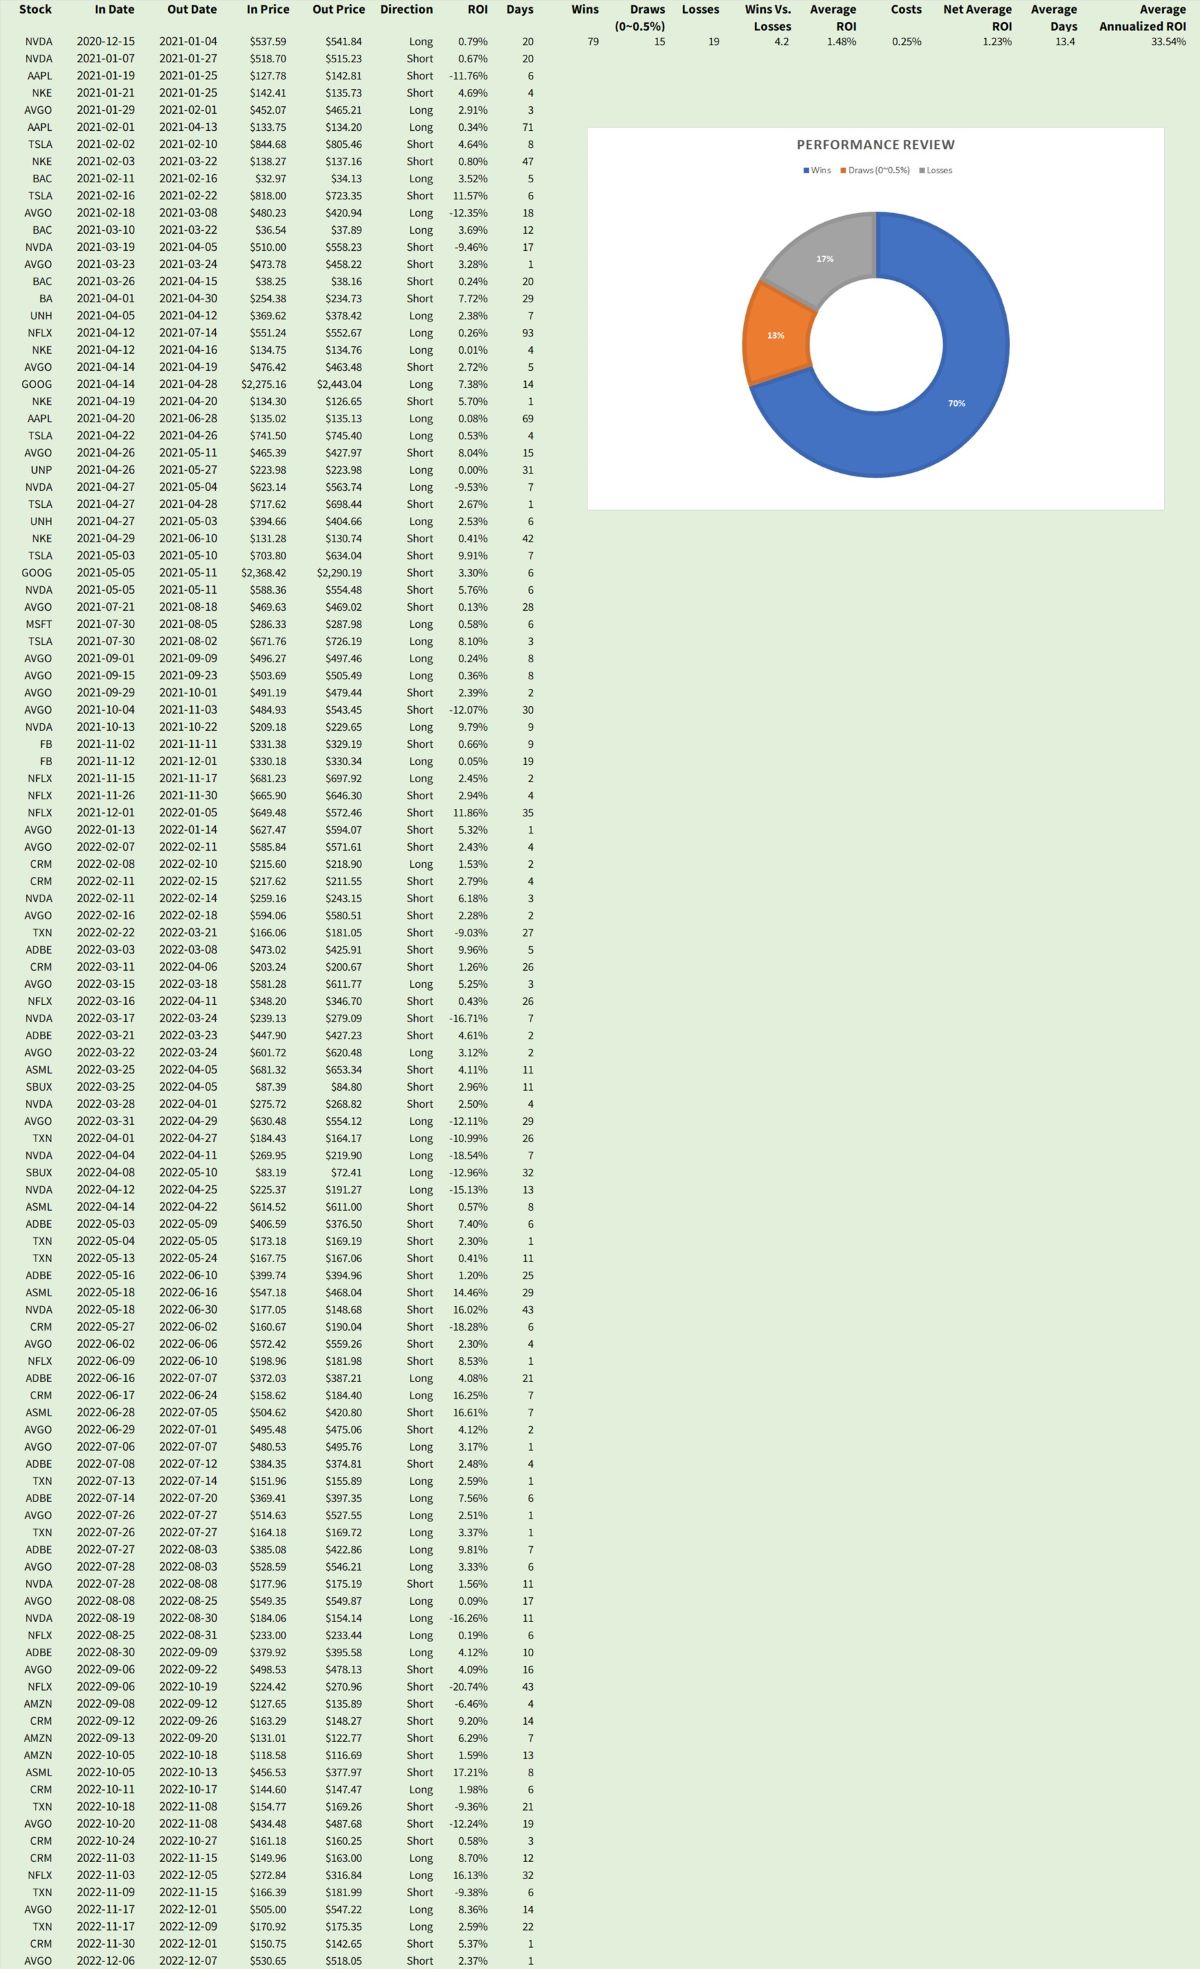
In these 113 groups of consecutive forward testing (conditions: real time,
real field, real price, virtual money) :
The Candlelight Quantitative
Trading System takes profit 79 times, break-even retreats 15 times, stops
loss 19 times. The Wins/Losses Ratio is 4.2:1, the average Return per trade
is 1.2%, and the average holding time is 13.4 days.
48 times Long and
65 times Short.
For Long positions, takes profit 30 times, break-even
retreats 10 times, 8 times stops loss. The Wins/Losses Ratio is 3.8 to 1,
the average Return per trade is 0.6%, and the average holding time is 14.9
days.
For Short positions, takes profit 49 times, break-even retreats
5 times, 11 times stops loss. The Wins/Losses Ratio is 4.5 to 1, the average
Return per trade is 1.7%, and the average holding time is 12.2 days.
Let's take a look back at some of the most dramatic events that happened
during the past 24 months and 113 groups of live testing:
December
2020: one full year of the COVID-19 outbreak;
January 2021: Capitol
Hill Riots, USA political turmoil;
August 2021: Afghanistan changed,
and the United States accepted defeat and withdrew hastily;
December
2021: two full years of the COVID-19 outbreak;
January 2022: USA
reports inflation rate hit 7% last month;
February 2022:
Russia-Ukraine war broke out;
March 2022: The Fed raised interest
rates by 25 points for the first time in nearly three years; America's
inflation rate jumped to 8.5% last month; Shanghai lockdown; The
Russia-Ukraine peace talk, which turned out to be a scam;
May 2022:
The Fed raised interest rates by 50 points due to severe inflation;
June 2022: USA inflation rate hit 8.6%, the highest since 1981; The Fed
raised interest rates by a whopping 75 points;
July 2022: US
inflation hit 9.1%, the highest since 1981; The Fed raised another
blockbuster 75 points interest rates; The USA economy grew at a negative
rate for the second quarter in a row; Political turmoil in UK, prime
minister resigned;
August 2022: China reported unemployment at 5.4%
last month and youth unemployment at 19.9%;
September 2022: Queen of
UK Elizabeth II died; Russia partially mobilized and the war escalated; The
explosion of the Nord Stream gas pipeline between Russia and Germany,
worsening the European energy crisis and high inflation; US inflation still
high, the Fed raised thirdly blockbuster 75 points interest rates;
October 2022: USA-Saudi Arabia relations broke down as OPEC+ announced crude
oil production cuts; The Crimean bridge was bombed; UK's new prime minister
resigns after just 45 days, the shortest serving in the history of UK;
November 2022: US inflation remained high and the Federal Reserve raised
interest rates by 75 heavy points for the fourth time this year;
December
2012: G7 and the European Union set a cap on the price of Russian oil, the
international energy supply waves again; Fed raises rates aggressively by 50
points to fight inflation...
Candlelight Quantitative Trading System
is surfing in such a stormy sea completely by its independent judgment. The
machine carries out whole process of long and short two-way operations, zero
human intervention. So far, this system has met or even exceeded our design
expectations.
Candlelight does not achieve this performance overnight. Since 2018,
this AI trading system developed by us has conducted forward simulation
tests in the US stock market according to the real-time market environment,
and posted every operation and action on social networks, left verifiable
records and milestones. It has been more than four years until 2022. The
algorithm has gone through three major iterations, optimization, polishing
and numerous small upgrades. Continuous tests show that: it is not a
"mission impossible" to completely make machine learning, automatically
generate buying and selling signals, operate without manual intervention in
the whole process, and make long-term profits. We have already gone through
this.
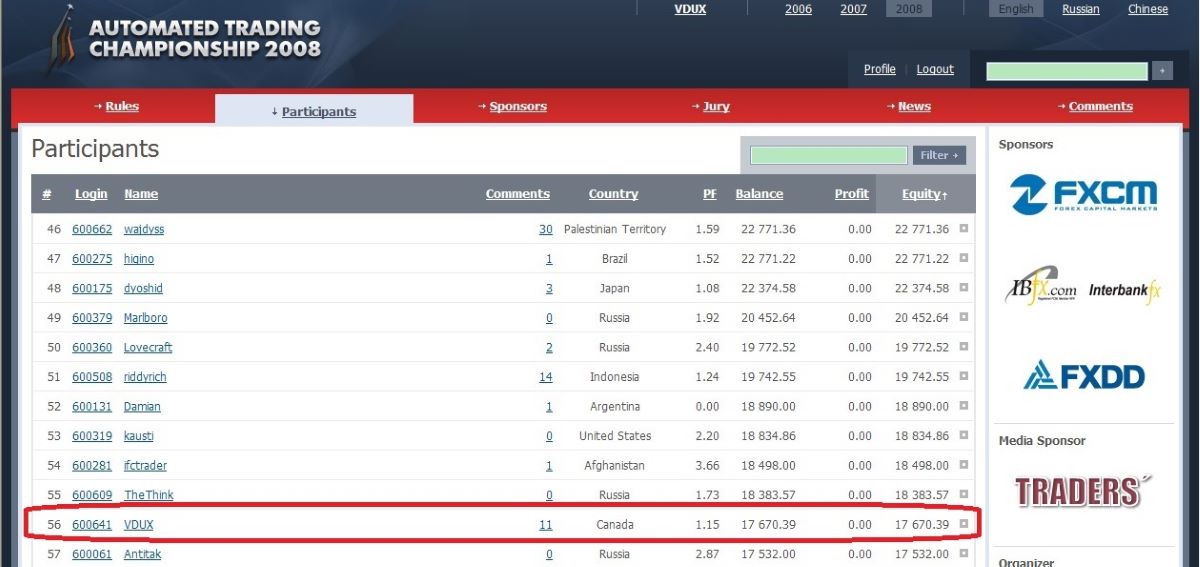
The creator of "Candlelight" once took part in the Automated Trading
Championship 2008, the highest level FOREX programming competition on the
Earth, and finally ranked 56th among 2420 participants in the world, a TOP
3% class rank.
Since February 2020, we have continuously published the real-time
forward test records of "Candlelight" in the US stock market on major social
networking sites. The original data and operation records of these
experiments can be reviewed. In each post, we reveal the next day's plan,
the target price, for readers and viewers to verify.
Our next stage of
optimization is to improve the stability of the growth rate, avoid big ups
and downs.
Candlelight keeps challenging the best players. Thanks for
continuous attention and witness.
Disclaimer:
This video or article, including all of its
features, content, and services, is provided for informational and
entertainment purposes only. All features, content, and services have been
researched and expressed to the best of its knowledge and belief.
Nevertheless, no guarantee can be provided for the correctness,
completeness, or accuracy of this information.
Please be aware: I am
neither a financial adviser nor a CPA. All Stock Trading Signals, Plans,
Predictions and Actions here are 100% generated by "Candlelight" Artificial
Intelligence Machine Learning Quantitative Algorithm. It is under testing in
real time and market prices, by virtual funds. Some of the models used by
Machine Learning Trading System are predictive in nature. The use of
predictive models has inherent risks. When Models and Data prove to be
incorrect or incomplete, any decisions made in reliance thereon expose the
System to potential risks. For example, by relying on Models and Data, the
System may be induced to buy certain targets at prices that are too high, to
sell at prices that are too low, or too early, or too late, then miss some
favorable opportunities.
The performance
represented is historical. Past performance may not be a reliable indicator
of future results. None of the authors, contributors, administrators, or
anyone else connected with this System, in any way whatsoever, can be
responsible for your use of the information contained in or linked from
here. Any action you take upon the information from here is strictly at your
own risk.
This video or article is based on personal
opinion and experience, and it should not be considered professional
financial investment advice. The ideas and strategies should never be used
without first assessing your own personal and financial situation. All
contents are our TEST records only, not for real trading. Market is
dangerous, trading is risky, DO NOT copy anything we do.
|


|

Free Tutorial
Share
|
|
|
|
